


Introduction
Correlation is the relationship between two values. When one changes, the other also changes. Correlation consists of “Positive correlation” and “Negative correlation”. A positive correlation is one in which one increases and the other also increases, and a negative correlation is one in which one increases and the other decreases.
The “Correlation Coefficient” is a statistical index showing the degree of correlation. The correlation coefficient takes a value between −1 and 1. The closer it is to 1, the stronger the positive correlation, and the closer it is to −1, the stronger the negative correlation.
“CORREL function” of Excel
Before going to TradingView, I will introduce the “CORREL function” that calculates the correlation coefficient in MS Excel.
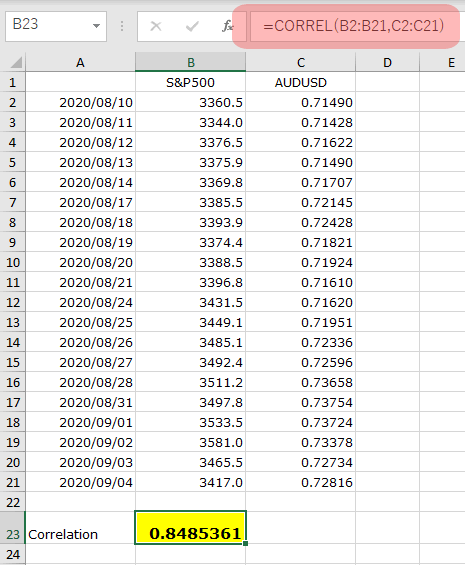
The arguments of the CORREL function are “=CORREL(array 1, array 2)”.
The sample below is a table of closing prices for the S&P500 and AUDUSD for the last 20 days.
(In cell B23, enter “=CORREL(B2:B21,C2:C21)”.)
As a result, the correlation coefficient between the S&P500 and AUDUSD has been calculated as “0.8485361” for the last 20 days.
“Correlation Coefficient” indicator of TradingView
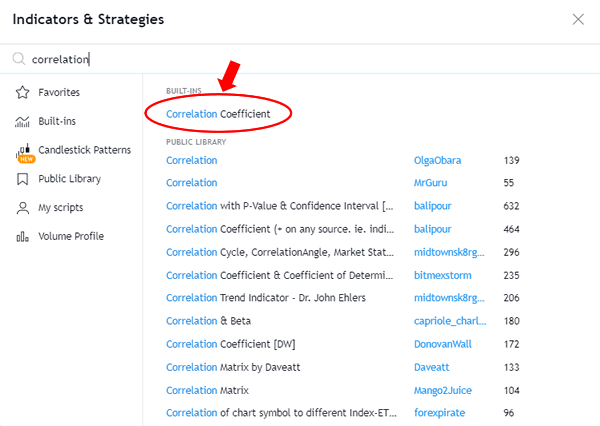
Next, I will introduce the function of displaying the correlation coefficient by TradingView. Open the indicator menu and enter “Correlation” to select the “Correlation Coefficient” indicator below.
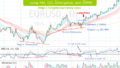
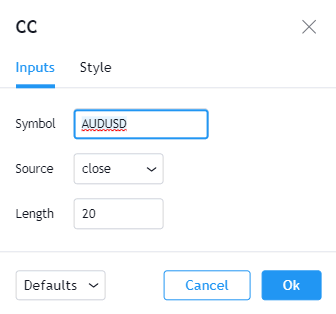
For example, with the S&P500 Index chart, enter the target item and period (in this example, target is closing price of AUD/USD and the target period is 20).
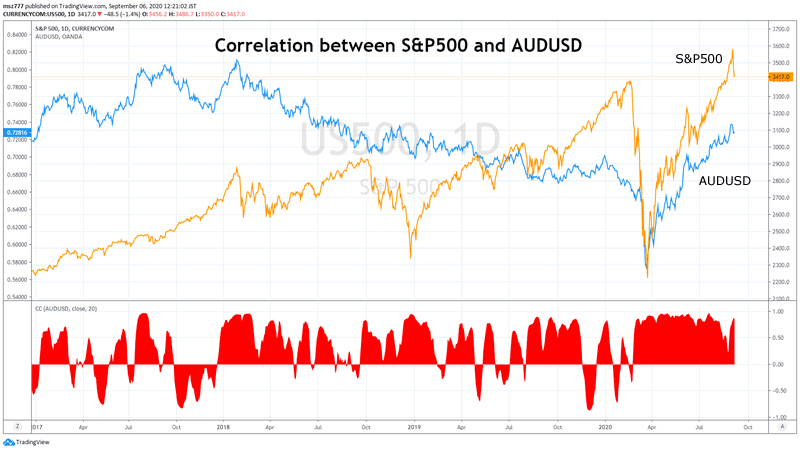
As a result, the correlation coefficient is displayed in the indicator window in the chart below.
This time, I explained that correlation analysis is troublesome in Excel, but it can be easily done in TradingView.
From next time, I would like to see various correlations for many trade targets concretely.