


Introduction
Continuing from the last article, this time I will explain the contents of the “plot function” as the basics of TradingView’s original language “Pine Script”.

After explaining the plot function, I would like to add a MACD histogram for the MACD indicator created last time by using the detail settings of the plot function this time.
Arguments of plot function
As I explained in the last article, the plot function is a function that draws the specified value on the chart. Last time I omitted a lot of arguments because the default value can be omitted.
The plot function has many arguments, as shown below.
| Arguments | Description |
| series | Specify the target (series) of the data to be drawn. This argument is a required item. |
| title | Specify the name (title) of the object to be drawn. It is possible not to specify it, but if it is specified, it will be displayed on the setting screen, so if it is an indicator that displays multiple similar lines, it will be easier to use if it is set. |
| color | Specify the color of the object to be drawn. Specifying “color = color.red”, specifying “color = # ff001a”, or “color = close> = open? color.green: color.red” (the color is green if the closing price is greater than or equal to the initial price, In other cases, the color is red). It is possible not to specify. It is also possible to change it on the setting window after specifying it. (* The “fill function” that fills the space between the two plots with the background color will be explained later in another article.) |
| linewidth | Specify the thickness of the object to be drawn from 1 to 4. The default is “1”. |
| style | Specify the style (type) of the line to be drawn from the following in the format of “style = plot.style _ …”. plot.style_line (line chart) plot.style_stepline (Step line) plot.style_histogram (histogram) plot.style_cross (cross mark) plot.style_area (area chart) plot.style_columns (bar chart) plot.style_circles (circle) If not selected, the default “plot.style_line” (line chart) will be displayed. |
| transp | Specify the transparency. Specify a number in the range from 0 (completely visible without transparency) to 100 (completely transparent and invisible). |
| trackprice | When set to True, it draws a horizontal line at the latest value level. Specify with “true” or “false”. The default is “false”. If not specified or specified as “false”, the horizontal line will not be displayed. |
| histbase | When the style is “plot.style_histogram” “plot.style_columns” “plot.style_area style”, specify the level that will be the starting point of drawing numerically. If not specified, the default is 0.0. |
| offset | Specify this to shift the drawing to the left or right. The default is 0. |
| join | When the style is “plot.style_cross” and “plot.style_circles styles”, specify whether to connect each drawing with a line. The default is “false”. |
| editable | Specify “true” or “false” whether the setting can be changed on the setting window. The default is “true”. |
| show_last | If specified, the specified number of bars will be displayed from the last bar. If not specified, the maximum number of bars that can be displayed will be displayed. |
| display | Set the display / non-display of the drawing with “display.none” and “display.all”. The default is the display “display.all”. |
You can find out more about each variable and function in the reference manual below.
Pine Script language reference manual
https://www.tradingview.com/pine-script-reference/v4/
Sample 2(Adding histogram on MACD)
I would like to add a histogram (deviation width between MACD and signal) to the MACD drawn in the sample of the previous article by using the detailed settings of the Plot function above.
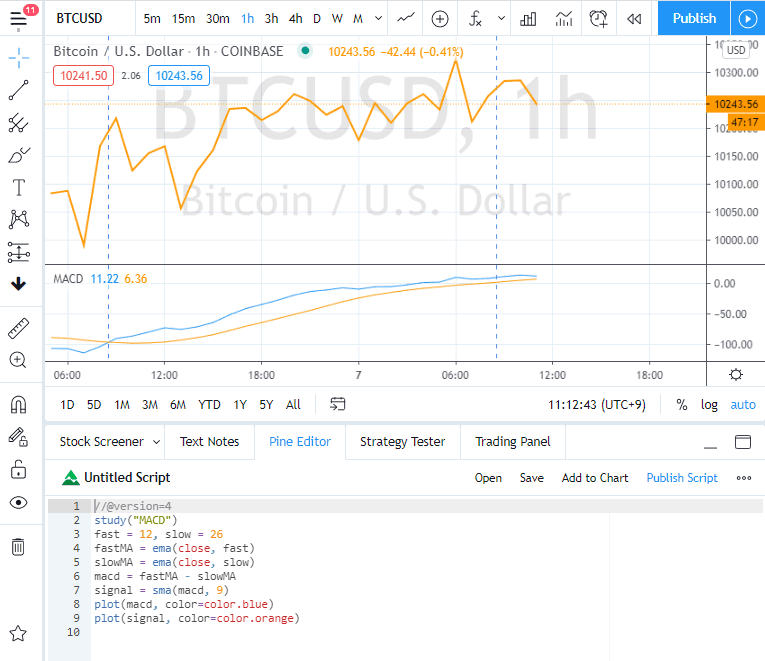
The previous script is as follows.
//@version=4
study(“MACD”)
fast = 12, slow = 26
fastMA = ema(close, fast)
slowMA = ema(close, slow)
macd = fastMA – slowMA
signal = sma(macd, 9)
plot(macd, color=color.blue)
plot(signal, color=color.orange)
The indicators displayed in the previous article are as follows.
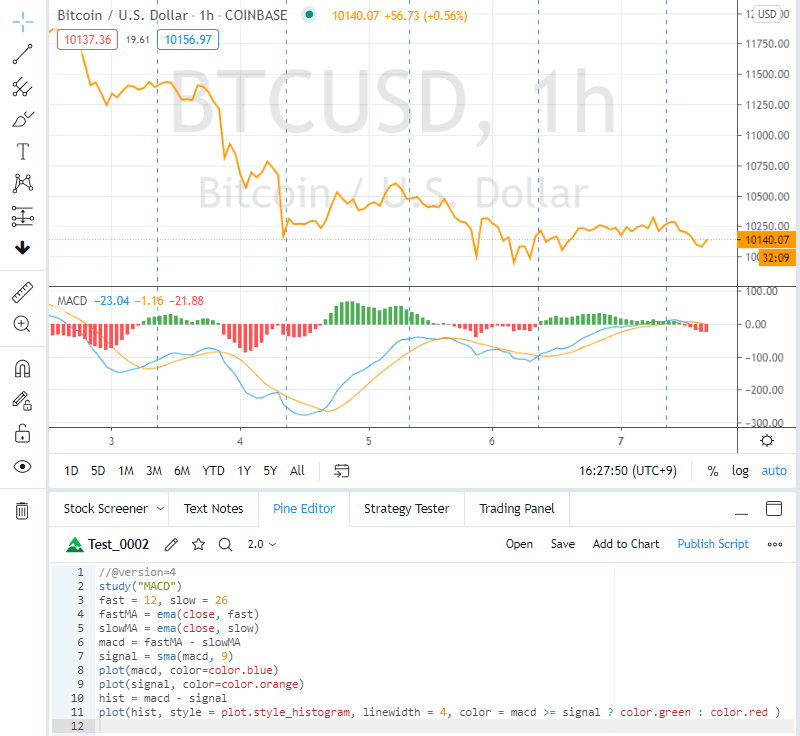
This time, I will add it to the previous script as follows.
//@version=4
study(“MACD”)
fast = 12, slow = 26
fastMA = ema(close, fast)
slowMA = ema(close, slow)
macd = fastMA – slowMA
signal = sma(macd, 9)
plot(macd, color=color.blue)
plot(signal, color=color.orange)
hist = macd - signal //This was added.
plot(hist, style = plot.style_histogram, linewidth = 4, color = macd >= signal ?
 color.green : color.red ) //This was added.
As a result, the indicators displayed this time are as follows. We can see a histogram of MACD.