


Introduction
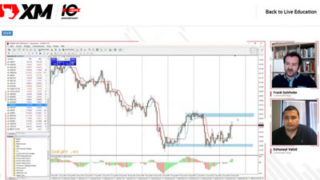
TradingView is easier to use than MT4, so I’ve been using it recently (although I’m also using MT4).
In this article, I would like to introduce the “Magnet Mode” function that greatly enhances the operability of TradingView. By using the “Magnet Mode”, you can draw not only beautifully but also “accurately”, so it will affect the trading performance.
What is “Magnet Mode”?
The magnet mode is a function that to snap the “drawing anchors” of various drawing tools (including trend lines and horizontal lines) to the closest OHLC (open, high, low, and close prices) of the nearby bars.
You can click the magnet icon in the drawing panel to activate Magnet Mode.
It is very convenient because you can draw horizontal lines and trend lines accurately on chart points. It is advantageous for trading if you draw the horizontal line, which means the chart point that every trader is paying attention to, accurately using Magnet Mode.
Even if you do not click this icon, if you draw while pressing the “Ctrl (Control)” button, magnet mode will be enabled. This is faster.
If you get used to the Magnet Mode, I think that it may be always on. In this case, pressing the “Ctrl (Control)” button will turn off magnet mode.
I think it’s obviously better to draw horizontal lines in Magnet Mode, but when drawing diagonal trend lines, each trader may have different opinion to use Magnet Mode or not to use.
If you move the mouse over the magnet mode button, the “>” mark will be displayed on the right side of the button. You can click this area to select “weak magnet” or “strong magnet”.
The most effective use of Magnet Mode is to draw Fibonacci
Magnet Mode is most effective when drawing Fibonacci such as Fibonacci retracement. This is especially important for long time-frame charts such as daily charts.
Grab the blue circle (it is called the “drawing anchor”) at the tip of the Fibonacci line as shown above and move it close to the high price you want to hit the Fibonacci, and it will stick to the high price of the target bar as shown below.