


Introduction
TradingView provides a unique scripting language called “Pine Script“. This allows users to create their own original indicators (custom indicators) for analysis and trading as strategy.
In TradingView, an introductory user manual for Pine Script is available.
TradingView “Pine Script v4 User Manual”
https://www.tradingview.com/pine-script-docs/en/v4/index.html
First sample of custom indicator created by Pine Script
Here’s how to create and display your own indicator with Pine Script.
1. From the menu at the bottom of the chart in TtradingView, click “Pine Editor”.


2. The Pine Editor, which is work area for entering scripts, is displayed as shown below.

3. Enter the script.
The script below is from the TradingView User Manual and is a sample MACD indicator. (The content of the script will be explained later in this article.

4. Click “Add to Chart” at the top right of the script entry area.

5. The MACD indicator is displayed as shown below.
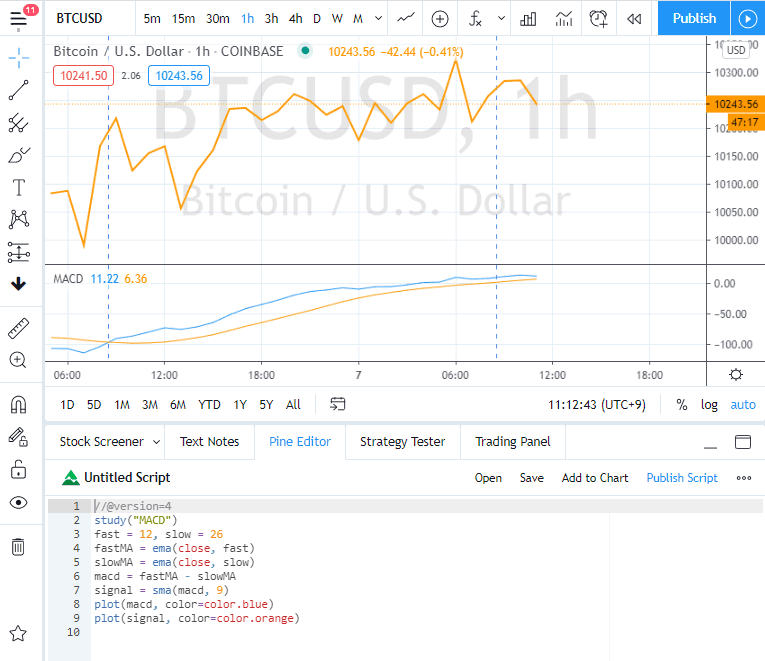
Description of MACD sample script
The contents of the MACD sample script used in the above figure are as follows.
//@version=4
study("MACD")
fast = 12, slow = 26
fastMA = ema(close, fast)
slowMA = ema(close, slow)
macd = fastMA - slowMA
signal = sma(macd, 9)
plot(macd, color=color.blue)
plot(signal, color=color.orange)
//@version=4
The comment tells the compiler that the script should use current version of Pine Script (= version 4).
(It can be always the same input.)
study(“MACD”)
Define the title of the script displayed on the chart as “MACD”.
(In addition to the title, the “study” function can define the subtitle and the overlay (whether it is displayed on the chart instead of the indicator window or not), but now let’s learn that it is a function that defines the title.)
fast = 12, slow = 26
Define two variables, fast and slow, and set 12,26 as the variable values, respectively.
fastMA = ema(close, fast)
The “ema” function is a function that returns EMA (Exponential Smoothing Moving Average). The closing price (close) and period (variable fast = 12) are set as arguments.
Define variable called fastMA to set the value of the function ema.
slowMA = ema(close, slow)
Set in the same way as fastMA above.
macd = fastMA – slowMA
Define variable called macd and set the value obtained by subtracting the variable slowMA from the above variable fastMA.
signal = sma(macd, 9)
The “sma” function is a function that returns SMA (Simple Moving Average). The closing price (close) and period 9 are set as arguments. Define a variable called signal to set the value of the function sma.
plot(macd, color=color.blue)
The “plot” function is a function that draws an indicator. As arguments, the variable to be drawn (macd) and the line color (blue) are set.
plot(signal, color=color.orange)
Draw the signal in the same way as drawing the macd above.