


Introduction
The Woodies CCI official reference manual introduces four patterns as “trend follow” for entry in the trend direction and six methods as “counter trend” for entry in the opposite direction to the trend. I will introduce total 10 patterns in order. In the first half, I will introduce four methods of trend following.
What is ZLR trade pattern?
The first pattern is called “ZLR pattern (Zero Line Reject)”.
The ZLR pattern is a strategy to focus on the timing in which the CCI line temporarily returns to the zero line direction opposite to the trend, or after crossing the zero line, to return to the original trend direction.
Example chart of ZLR trade pattern (uptrend)
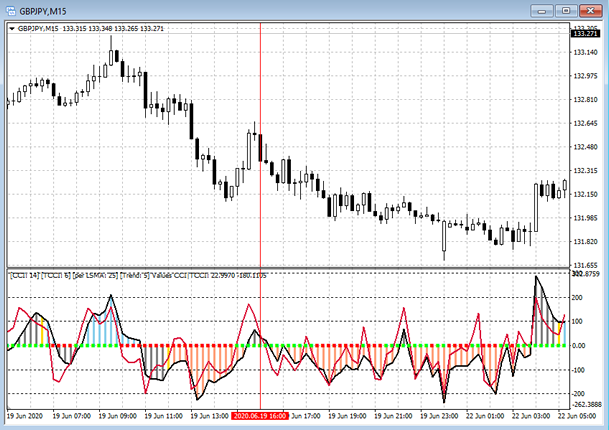
Below is an example chart of the ZLR pattern in uptrend.
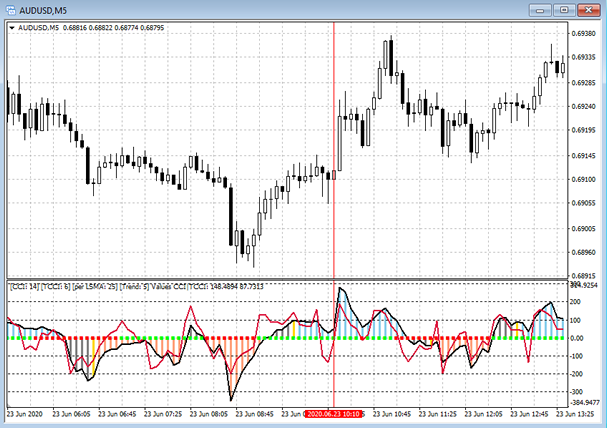
After the bar color turns blue and an uptrend is established, the TCCI and CCI lines can be seen moving back towards zero line.
The entry point is when CCI rebounds (at the red vertical line). You can see that TCCI fall below the zero line and rebounds after exceeding minus 100, after that, CC rebounds.
As I’ll explain in a later article, the ZLR pattern is not only used alone, but also with other pattens.
I would like to introduce another example of uptrend ZLR pattern.
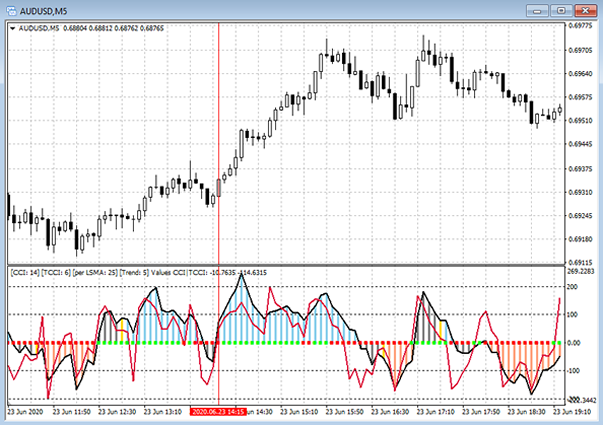
In above example chart, the red vertical line means the entry point.
In this case, not only the TCCI line but also the CCI line once fell below 0 and then returned to the uptrend. This also shows clear “buy on dips“.
Woodies CCI official reference mentions that it is not a “true reject” unless the CCI line as well as the TCCI line crosses zero line in this way (“It really hasn’t rejected it until it crosses zero line”)
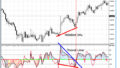
Sample chart of ZLR trade pattern (downtrend)
Next, I will show the case of downtrend (“sell on rally“). The red vertical line is the entry point.
According to the official reference, it is possible to enter 20 seconds before the bar is confirmed, without waiting for the bar to be confirmed.
I’ll explain the timing of exiting in later article.
My articles have the following structure.
Woodies CCI – Strategy Analysis (1) Basic
Woodies CCI – Strategy Analysis (2) ZLR trade pattern
Woodies CCI – Strategy Analysis (3) RD trade pattern
Woodies CCI – Strategy Analysis (4) TLB and HTLB trade pattern, Exiting
Woodies CCI – Strategy Analysis (5) Famir, Vegas, and Ghost trade pattern
Woodies CCI – Strategy Analysis (6) FFE, TLB, and HTLB trade pattern (counter trend)