


What is Woodies CCI?
“Woodies CCI” is a unique trading indicator and strategy based on two CCI lines with different periods. It was invented by Mr. Ken Wood. It is already internationally become popular, and there are various derivative systems.
Official website of Woodies CCI is as follows.
http://woodiesbars.com/
You can access official reference manual of Woodies CCI from the URL below. Woodies CCI Basic Patterns and Terminology By James O’Connel(English) https://forex-indicators.net/files/indicators/woodiescci.pdf
Also, everyone can download Woodies CCI indicator (using at MT4) from the URL below for free. https://forex-indicators.net/mt4-indicators/real-woodie-cci
Components of Woodies CCI
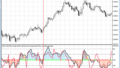
Please take a look at sample chart below. 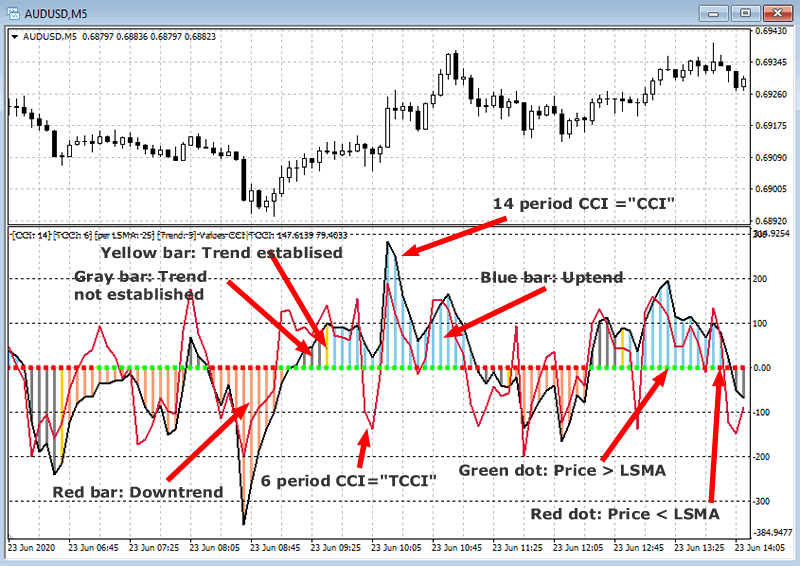
- Black line: 14-period CCI (called “CCI”)
- Red line: 6-period CCI (called “TCCI”)
- CCI level 0 line, plus or minus 100 line, plus or minus 200 line
- Gray bar: A bar display of the 1st to 4th CCI values after CCI has passed the zero line up and down (trend not established)
- Yellow bar: After the CCI has passed the zero line up or down, the bar display of the fifth CCI value (trend change)
- Blue bar: After the CCI has passed above the zero line, the bar display of the 6th and subsequent CCI values (uptrend)
- Red bar: After CCI has passed below the zero line, the bar display of the CCI value after the sixth line (downtrend)
- Green dotted line displayed on the zero line: means the current price is above the LSMA moving average for period 25
- Red dotted line displayed on the zero line: means the current price is below the LSMA moving average line for period 25
Judgment of “trend”
One of the special characteristics of Woodies CCI is that if the price stay in the same area (above or below the zero line) after the CCI crosses the zero line, the “Trend” is established. Official reference manual mentions as follows.
- Determine trends using Woodies CCI alone
- Do not use charts to judge trends
- Do not use moving averages to determine trends
- Do not use large time frames to determine trends
From next article, I will start to analyze each trading pattern using Woodies CCI. My articles have the following structure.
- Woodies CCI – Strategy Analysis (1) Basic
- Woodies CCI – Strategy Analysis (2) ZLR trade pattern
- Woodies CCI – Strategy Analysis (3) RD trade pattern
- Woodies CCI – Strategy Analysis (4) TLB and HTLB trade pattern, Exiting
- Woodies CCI – Strategy Analysis (5) Famir, Vegas, and Ghost trade pattern
- Woodies CCI – Strategy Analysis (6) FFE, TLB, and HTLB trade pattern (counter trend)