


Introduction: What is CCI?
CCI is an abbreviation for “Commodity Channel Index”, which is a technical indicator which belongs to oscillators. As its name suggests, it is said that it was originally used in commodity trading, but now it is widely used in other markets such as forex and stocks. CCI may not be a popular indicator in your country, but it is globally used. CCI is also included as standard in MT4 PC apps and smartphone apps.
CCI was invented in 1980 by Mr. Donald R. Lambert. CCI is calculated by the following formula.
A: moving average price – current price (*)
B: simple moving average of “A” over the past certain period(*) current price: average of high, low, and closing price
While many other technical indicators such as RSI use “closing price” as the “current price”, CCI uses “average of high, low and closing price”. as the “current price”. Dividing by 0.015 is the same as multiplying by 2/3 x 100. (The denominator of 0.015 is interpreted as a value for adjusting so that plus or minus 100% level works as a result.)
One of the features of CCI is that it uses the “average of high, low, and closing price” for the “current price”.
CCI is quick and sensitive indicator
Quick reaction
The first reason why I think CCI is one of the most powerful indicators is that it’s super quick! It reacts quicker than other oscillators. See the chart below for a clear example.
This chart shows RSI and CCI (both periods are 14) on the hourly chart of GBPUSD. It can be seen that CCI responds to price movements on the chart quicker than RSI, and divergence also occurs faster than RSI.
The quick response means that there is a lot of “fake” on the other hand.
Sensitive response
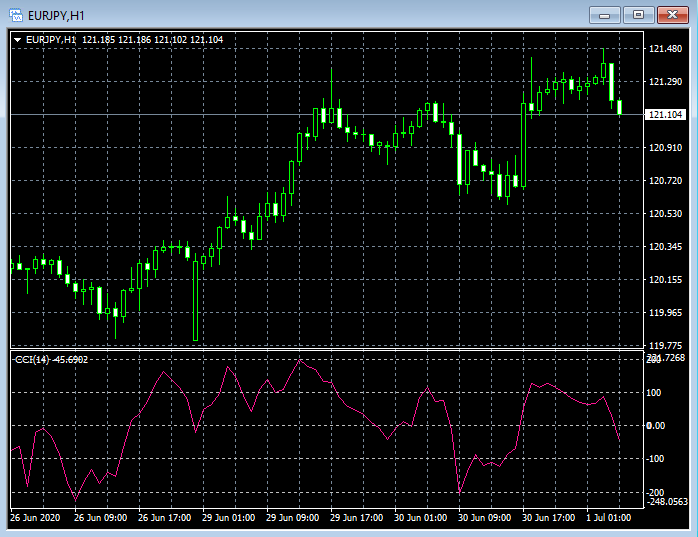
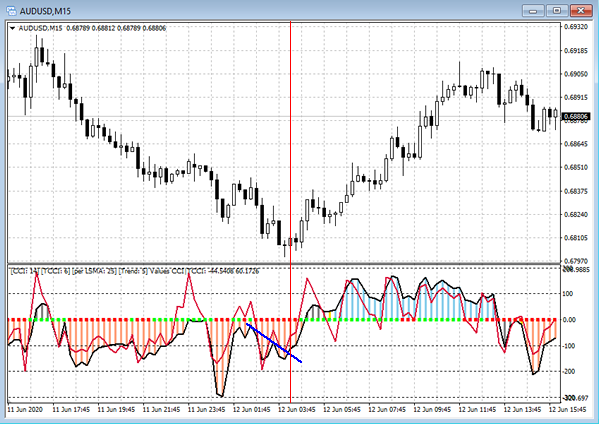
The next reason is that CCI responds sensitively. CCI line is jagged as it reacts sensitively to price movements. The following chart is introduced as a typical example.
This chart was used in the fifth “Ghost patern” of Woodies CCI’s trade strategy. (The thick black line in the Woodies CCI indicator is same as CCI of 14 period.) Since CCI is sensitive, you can use the small pullbacks on trend changes to make trades such as: The red vertical line is the entry point.
Please see the following article for “Ghost pattern” in Woodies CCI’s trade strategy.
Next time, I would like to write about “smoothing” of CCI.