


Introduction
This is the fifth article about divergence trade strategy, and this is the last article.
In this article, I would like to write why hidden divergence implies continuing trends?
So, why hidden implies a continuation of the trend?
Why hidden divergence implies continuation of trend?
Why does hidden divergence suggest a continuing trend?
Taking RSI as an example, the formula for calculating RSI is as follows.
RSI = Ratio of rising and falling widths in the last certain period
RSIs at two different timing are calculated at different periods.
The value of the oscillator, which shows the market momentum, is similar to the engine speed.
While increasing the car speed, engine speed decreases once each time a gear is changed from a low speed gear to a high speed gear, and then increases again. However, increase of engine speed is smaller than increase of car speed.
The point where the car speed is the highest is where the engine of the high-speed gear begins to decrease.
In the market where many people participate, something like moment of inertia similar to automobiles is working,
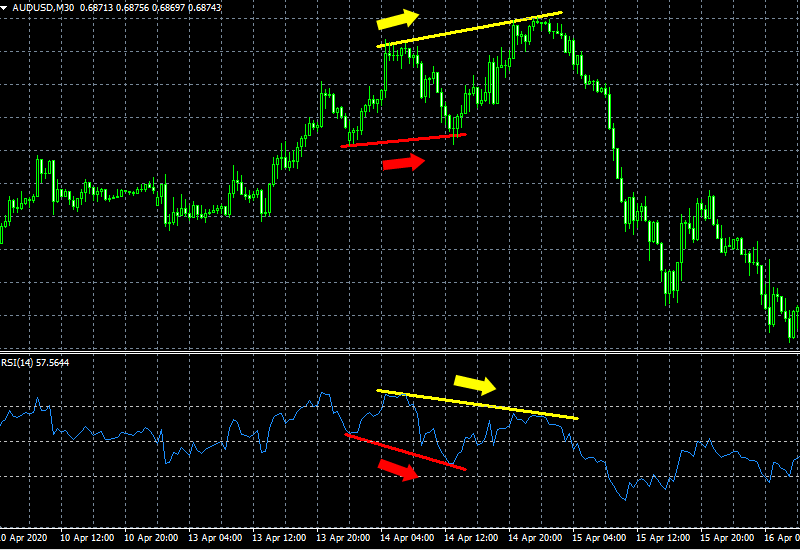
- Hidden divergence means that when the chart starts to rise, the market will accelerate again with the addition of less power.
- Regular divergence means that when the chart rises to the maximum, the power of the market is not the highest point but the peak of a little weak place.