


What is Effective Exchange Rate?
In addition to the general exchange rate which has partner currency, there is another exchange rate called the “Effective Exchange Rate”, which is calculated by weighted averaging the amount of trade transactions with the trading partner countries.
The effective exchange rate is an index for evaluating the external competitiveness of each currency country and the comprehensive strength and value of each currency. There are two types of effective exchange rate as follows.
- “Nominal effective exchange rate” before taking into account the inflation rate
- “Real effective exchange rate” after taking into account the inflation rate
The real effective exchange rate is considered to more accurately reflect the strength of the currency because it takes into account actual price fluctuations. Therefore, the real effective exchange rate is more popular.
Where can we get effective exchange rate data?
You can download the effective exchange rate data for each country from the BIS (Bank for International Settlements) website.
The page of the effective exchange rate on the BIS website is as follows↓.
Effective exchange rate indices
https://www.bis.org/statistics/eer.htm
For this analysis, we will download the Excel for the red arrow “Monthly data: Narrow indices” above.
Effective exchange rates of G10 currencies
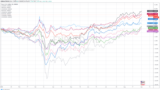
The chart below summarizes the effective exchange rates of G10 currencies based on the above BIS data from 2010.
The solid line of each currency is the real effective exchange rate, and the dotted line is the nominal effective exchange rate.
(The monthly average for 2010 is 100. The latest data is for July 2020.)
The Japanese Yen has fallen sharply since 2013, when “Abenomics” monetary easing policy began.
The ECB introduced a negative interest rate in June 2014, and quantitative monetary easing began in January 2015.
The British Pound has fallen sharply around June 2016, when the Brexit referendum was held.
The Swiss franc shock struck on January 15, 2015.
In some cases, such as the Bank of England in the UK and the ECB in Europe, the effective exchange rate is calculated independently.
I would like you to compare this article with another article “G10 currency analysis.” as below.