


Introduction
Since it is October from yesterday, I would like to make a monthly analysis of the strength of the G10 currency.
In this series of articles, I compare the currency strengths of the major currency group called “G10 Currency” at the beginning of each month for the year-to-date (YTD) and the previous month (MTD).
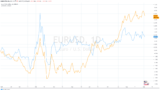
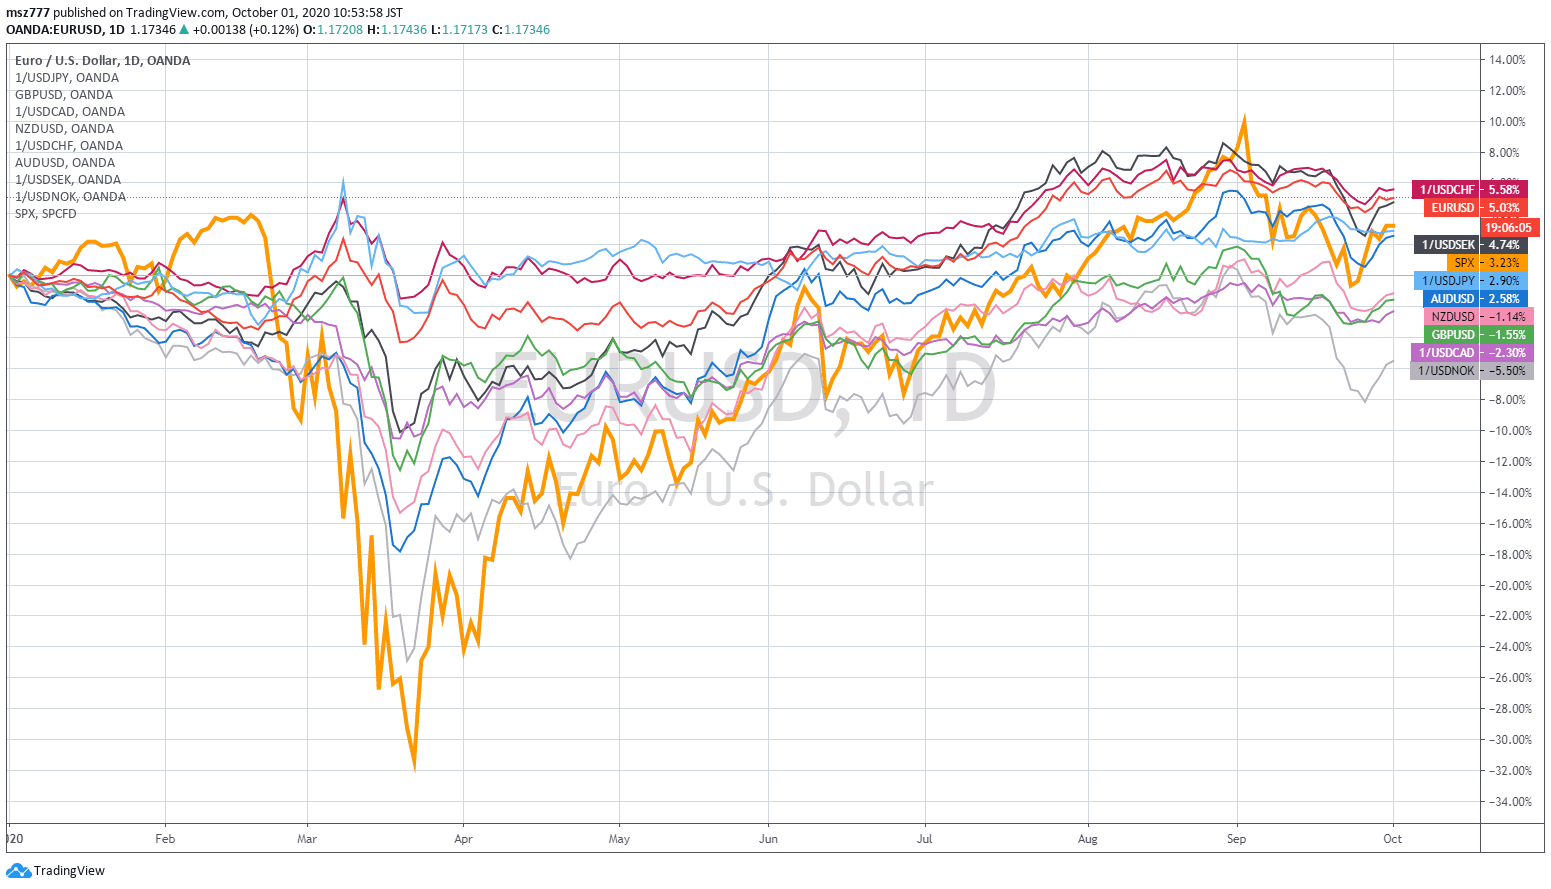
Currency strength analysis of G10 currencies (YTD: 2020)
(Please click to the chart to enlarge)
The order of currency strength from the beginning of the year in 2020 is as follows (from strongest to weakest).
- CHF (brown)
- EUR (red)
- SEK (black)
- JPY (light blue)
- AUD (blue)
- USD (Since it is a relative comparison target, it is not displayed.)
- NZD (pink)
- GBP (green)
- CAD (purple)
- NOK (gray)
The bold orange line means the US stock (S&P500).
In September, with the fall of US stocks from the beginning of the month, most currencies fell against USD, and it can be seen that the upward trend after the pandemic plunge was modulated and the adjustment phase continued.
NZD and GBP have risen significantly since last month, while SEK, NOK and AUD dollars have relatively fallen.
Until last month, AUD showed the most outstanding performance after the pandemic plunge. AUD’s depreciation was relatively large in September, with all currencies depreciating against USD except JPY, but the performance of AUD from the beginning of the year is still higher.
Many major currencies have been higher against the US dollar since the beginning of the year after the volatility caused by the Covid-19 pandemic, while the NZD, GBP, CAD and NOK are lower than at the beginning of this year.
Currency strength analysis of G10 currencies (MTD: 2020-Sep)
(Please click to the chart to enlarge)
The order of currency strength in the single month of September 2020 (MTD) is as follows (from strongest to weakest).
- JPY (light blue)
- USD (Since it is a relative comparison target, it is not displayed.)
- CHF (brown)
- EUR (red)
- CAD (purple)
- NZD (pink)
- AUD (blue)
- SEK (black)
- GBP (green)
- NOK (gray)
All currencies other than JPY have fallen against USD in last month. However, at the end of the month, there are signs of a reversal rise as US stock market reversal.